
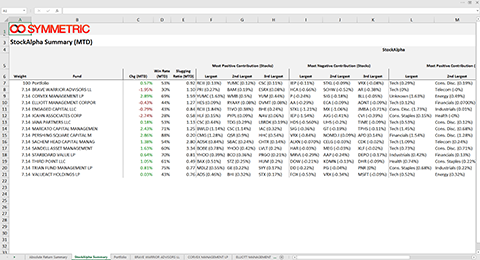
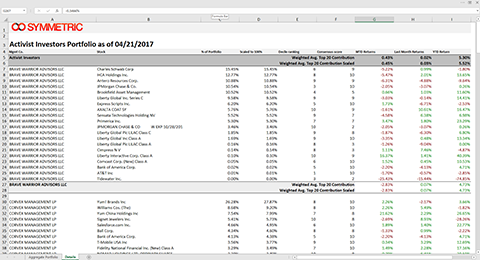
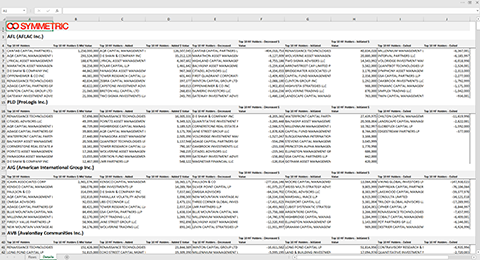
About the Portfolio Workbook Report
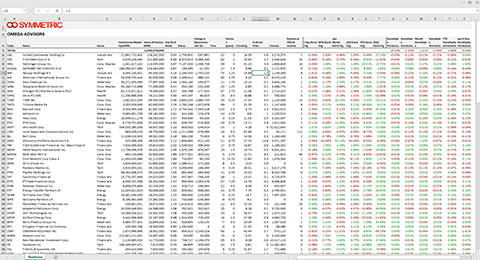
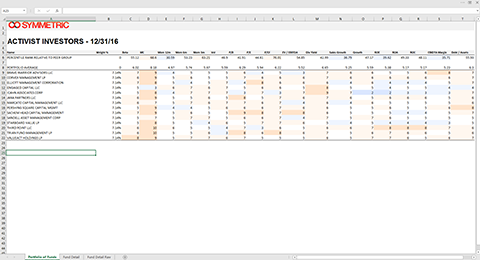
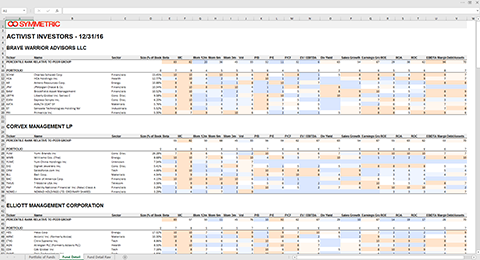
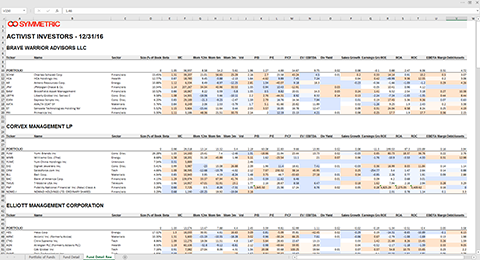
The Symmetric Portfolio Workbook provides performance attribution for a portfolio of managers and the individual manager attribution themselves. Attribution is calculated on a long-only and a StockAlpha basis. StockAlpha calculates a position’s and portfolio’s performance based on the manager’s stock-picking ability. Specifically, it hedges each position on a market, beta, and sector basis to isolate the impact of the manager’s stock-picking decisions on a portfolio. The report also includes technical detail on the position’s institutional float, liquidity etc, as well as proprietary measures, such as the the popularity and concentration of hedge fund ownership, as in crowding.
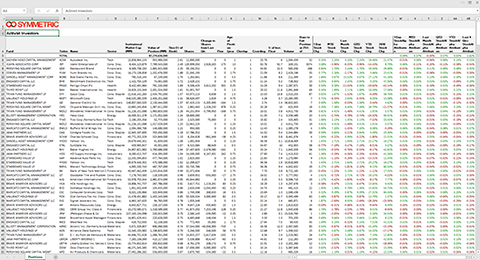
About the Top Positions Report
The Top Positions Report provides performance attribution for a portfolio of managers and the individual manager attribution themselves. Attribution is calculated on a long-only basis. The Symmetric Top positions report allows a user to easily visualize the top positions in the aggregate portfolio of managers and easily drill down into the details of the key positions for each fund. This report is similar to the Workbook, except that it is much easier and easier to consume and print out.
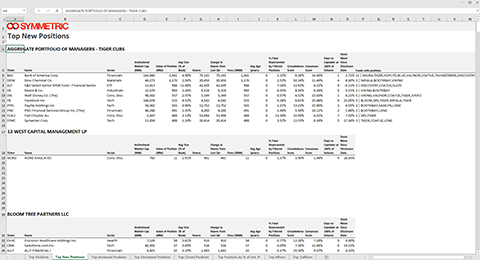
Position Changes Report
The Symmetric Position Changes Report provides an excel workbook with a comprehensive analysis of how the aggregate constituents of a portfolio of hedge funds has changed since the prior reporting period. It shows the new, closed, increased and decreased positions on a per-share and flows basis. Moreover, it juxtaposes the percent of institutional float held by the combined holdings of the managers in the portfolio with the crowding and consensus scores of each position. This provides transparency regarding the role the underlying managers in the portfolio have in the overall crowding of the position.
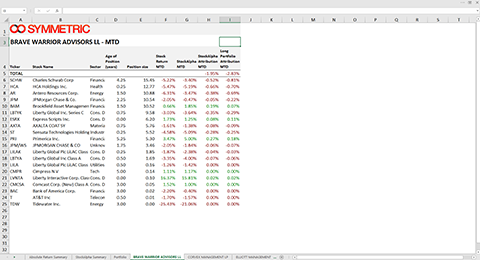
Manager Performance Attribution
The Symmetric Attribution Report provides performance attribution for a manager’s portfolio. Attribution is calculated on a long-only and a StockAlpha basis. StockAlpha calculates a position’s and portfolio’s performance based on the manager’s stock-picking ability. Specifically, it hedges each position on a market, beta, and sector basis to isolate the impact of the manager’s stock-picking decisions on a portfolio. The report also includes technical detail on the position’s institutional float, liquidity etc, as well as proprietary measures, such as the the popularity and concentration of hedge fund ownership, as in crowding.
Symmetric Manager Overview
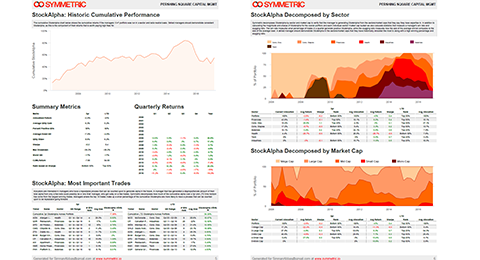
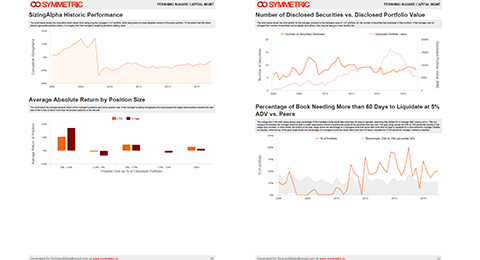
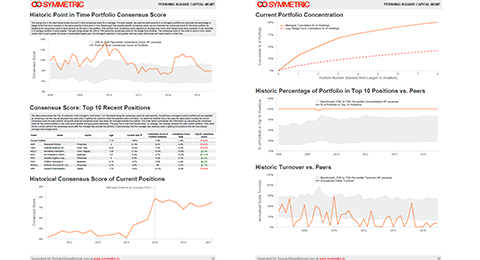
Symmetric Manager Reports provide an analysis of individual managers according to estimated performance, exposures, and investor skill. The reporting methodology combines is based on the best-practices of the most sophisticated institutional investors. Each 15-20 page PDF report systematically applies a Brinson Fachler derived performance attribution model to identify StockAlpha, SizingAlpha, and SectorAlpha. These are coupled with analyses of a manager’s largest winners, losers, and exposures to liquidity, hedge fund crowding, etc. A full description of the methodology and sections is included in each report.
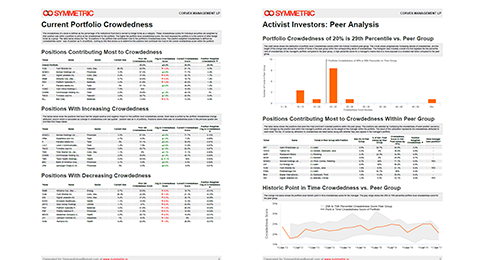
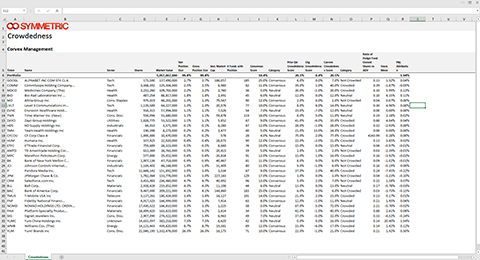
Symmetric Hedge Fund Crowding Report
The Symmetric Hedge Fund Crowding report provides a customized analysis of an individual manager’s exposure to crowded positions. The manager’s individual positions are addressed according to their individual level of crowding, the the aggregate crowding exposure may be ascertained. Next, the aggregate exposure is compared to the individual exposure of all hedge fund managers in the Symmetric universe to see the percentile rank among other managers of their exposure to hedge fund crowding. The default peer group consists of the hedge fund universe, but one may also use Symmetric or custom peer groups. These are available as PDF or excel reports. The excel report provides greater position-level transparency.
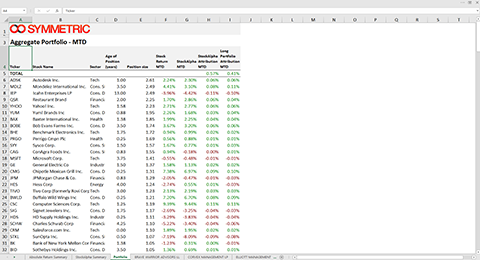
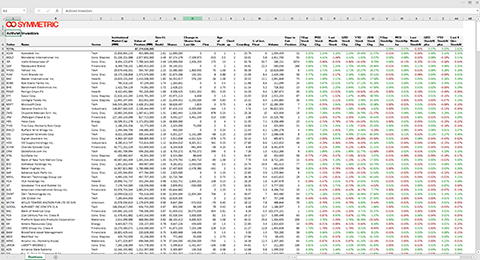
Symmetric Aggregated Portfolio Composition Report
The Symmetric Aggregated Portfolio Composition Report provides performance attribution for all positions across all managers in a portfolio. The Aggregated Portfolio Composition Report lists each stock's position across managers individually, so multiple owners of a single stock will be shown as a single row. Attribution is calculated on a long-only and a StockAlpha basis. StockAlpha calculates a position’s and portfolio’s performance based on the manager’s stock-picking ability. Specifically, it hedges each position on a market, beta, and sector basis to isolate the impact of the manager’s stock-picking decisions on a portfolio. The report also includes technical detail on the position’s institutional float, liquidity etc, as well as proprietary measures, such as the the popularity and concentration of hedge fund ownership, as in crowding.
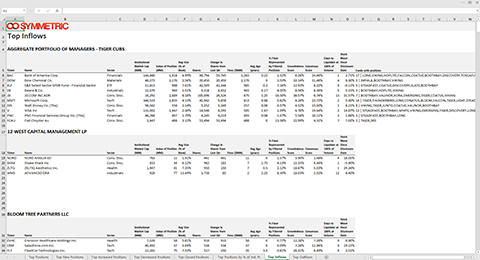
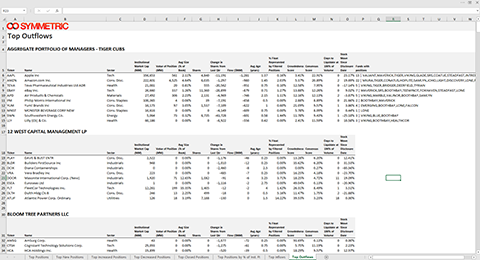
Symmetric Flows Report
The Symmetric Flows Report provides a workbook that shows the flow of hedge fund ownership of positions in a watchlist. The first worksheet provides the quarter over quarter measures of each position in the watchlist. These include: the number of managers that own it; the numbers increasing, decreasing, initiating or exiting the position; the corresponding dollar flows; hedge fund crowding and consensus (popularity) measures; and the liquidity of hedge fund exposure. The second sheet provides tables for each position and lists all managers that relate to these measures -- who’s entering, exiting, growing or sizing down an individual position, for example.
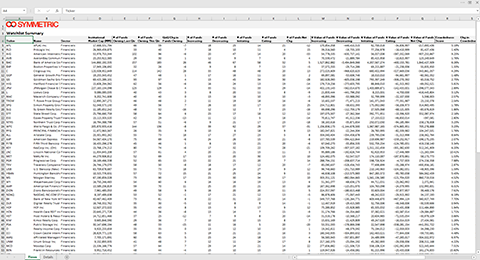
About The Disaggregated Portfolio Composition Report
The Symmetric Disaggregated Portfolio Composition Report provides performance attribution for all positions across all managers in a portfolio. The Disaggregated Portfolio Composition Report lists each manager’s position individually, so multiple owners of a single stock will be shown as multiple rows. Attribution is calculated on a long-only and a StockAlpha basis. StockAlpha calculates a position’s and portfolio’s performance based on the manager’s stock-picking ability. Specifically, it hedges each position on a market, beta, and sector basis to isolate the impact of the manager’s stock-picking decisions on a portfolio. The report also includes technical detail on the position’s institutional float, liquidity etc, as well as proprietary measures, such as the the popularity and concentration of hedge fund ownership, as in crowding.
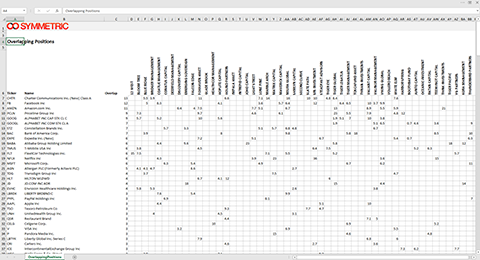
About the Position Overlap Report
The Symmetric Position Overlap report shows users which positions amongst a portfolio of managers are most common and which managers own them. This report allows users to easily visualize where they may be exposed to particular names in their portfolios of managers. the x-axis of the table contained in the report shows security names, while the y-axis shows managers within the portfolio. The numbers in each cell represent the position size of the security for the manager. The analysis is performed using the top 10 positions for each managers to isolate the key positions in each manager's portfolio.
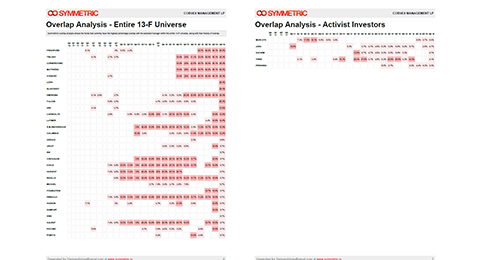
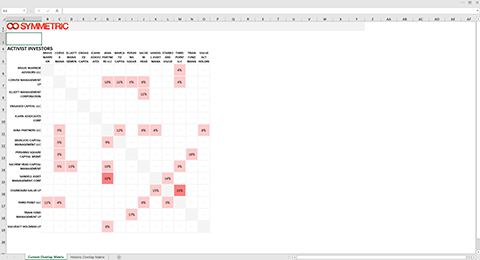
About the Manager Overlap Matrix Report
The Symmetric Manager Overlap Matrix report shows to what extent different managers within a portfolio of managers have similar positions. This allows users to track whether their overall portfolio of managers is likely to be exposed to particular individual positions that are shared across managers. The overlap matrix is calculated by filtering down each managers positions down to the top 10 and calculating the pairwise overlap between each fund. In the percentage overlap methodology, the numbers in each cell in the matrix represent how much of the x-axis managers portfolio is shared by the y-axis manager due to overlapping positions.
About Fundamental Factors Report
The Symmetric Fundamental Factor Portfolio Report shows the fundamental factor exposure for a portfolio of funds. The Symmetric factor report is generated on a position level basis. First, for a given manager, raw data on a library of fundamental and technical factors are collected. These factors are then scored on a decile basis within the Russell 3000. To illustrate, a stock with a very high P/E may be scored as being in the 10th decile relative to the Russell 3000. This would be indicated by a decile score of "10". After each manager's securities are scored on a decile basis, a weighted average decile score for each factor is calculated. This represents the portfolio level factor exposure score for each manager. These portfolio level factor exposure is reported for each manager in the portfolio of funds
About Hedge Fund Crowdedness Excel Download
The Symmetric Hedge Fund Crowding report provides a customized analysis of an individual manager’s exposure to crowded positions. The manager’s individual positions are addressed according to their individual level of crowding, the the aggregate crowding exposure may be ascertained. The excel report provides greater position-level transparency than the Hedge Fund Crowding Report PDF.
About Return Analytics PDF Report
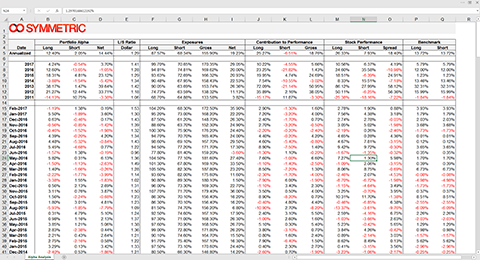
The Symmetric Returns Reports provide an automated, industry standard reporting infrastructure for tracking individual manager returns and the returns of portfolios of managers. Clients upload historical return-streams and exposures to the Symmetric Data Manager by copying and pasting into an excel-like interface that is fully editable. The manager-level returns analysis provides an Excel or PDF report standard statistical analyses, including alphas, betas, correlations, drawdowns, etc. The portfolio-level returns analysis provides an Excel or PDF report on how the combined portfolio of manager-allocations performs.
About Net return XLS Report
The Symmetric Flows Report provides a workbook that shows the flow of hedge fund ownership of positions in a watchlist. The first worksheet provides the quarter over quarter measures of each position in the watchlist. These include: the number of managers that own it; the numbers increasing, decreasing, initiating or exiting the position; the corresponding dollar flows; hedge fund crowding and consensus (popularity) measures; and the liquidity of hedge fund exposure. The second sheet provides tables for each position and lists all managers that relate to these measures -- who’s entering, exiting, growing or sizing down an individual position, for example.


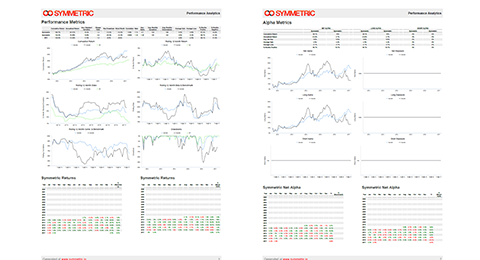
About the Long/Short Alpha Report
The Symmetric Long/Short Alpha Report provides a workbook that shows the alpha generated by managers' long and short portfolios. Clients upload historical long/short attribution and gross/net exposures data to the Symmetric Data Manager by copying and pasting into an excel-like interface that is fully editable. Users then select an appropriate benchmark for the manager. In seconds, the alpha report analyzes the manager's ability to generate alpha on the long and short side of their portfolio.
About the Performance Report
The performance report shows monthly returns for a portfolio of managers for whom the user has uploaded net returns.
About the Long/Short Alpha Report
The Symmetric Long/Short Alpha Report provides a workbook that shows the alpha generated by managers' long and short portfolios. Clients upload historical long/short attribution and gross/net exposures data to the Symmetric Data Manager by copying and pasting into an excel-like interface that is fully editable. Users then select an appropriate benchmark for the manager. In seconds, the alpha report analyzes the manager's ability to generate alpha on the long and short side of their portfolio.
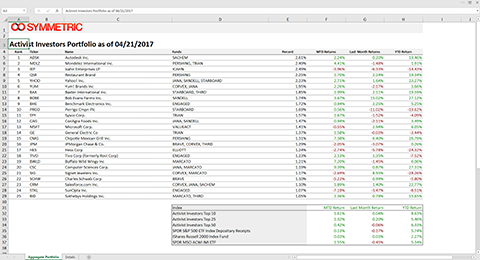
Client prospecting report preview
Report Settings
|
Stock Alpha
Sizing Alpha
Liquidity
Consensus/Contrarian Analysis
Concentration
Stocks Description
- Search
- Your Data
-
Uploaded Manager Data
- Indices
-
Symmetric Indices
- Crowded Stocks Index - Overall
- Crowded Stocks Index - Quants
- Crowded Stocks Index - Event Driven Managers
- Crowded Stocks Index - Tiger Cubs
- Crowded Stocks Index - Healthcare Focused Managers
- Crowded Stocks Index - Tech Focused Managers
- Crowded Stocks Index - Activists
- Crowded Stocks Index - Multi Managers
- Investable ETFs/Benchmarks
-
US
-
Global
- Managers (13-F Returns)
-
Recently Viewed Managers
- Portfolios (13-F Returns)
-
All Your Portfolios
-
Symmetric Portfolios
- Search
- Your Data
-
Uploaded Manager Data
- Indices
-
Symmetric Indices
- Investable ETFs/Benchmarks
-
US
-
Global
- Managers (13-F Returns)
-
Recently Viewed Managers
- Portfolios (13-F Returns)
-
All Your Portfolios
-
Symmetric Portfolios
- Clear Manager 2
- Search
- Your Data
-
Uploaded Manager Data
- Indices
-
Symmetric Indices
- Investable ETFs/Benchmarks
-
US
-
Global
- Managers (13-F Returns)
-
Recently Viewed Managers
- Portfolios (13-F Returns)
-
All Your Portfolios
-
Symmetric Portfolios
- Search
- Your Data
-
Uploaded Manager Data
- Indices
-
Symmetric Indices
- Investable ETFs/Benchmarks
-
US
-
Global
- Managers (13-F Returns)
-
Recently Viewed Managers
- Portfolios (13-F Returns)
-
All Your Portfolios
-
Symmetric Portfolios
- Search
- Your Data
-
Uploaded Manager Data
- Indices
-
Symmetric Indices
- Investable ETFs/Benchmarks
-
US
-
Global
- Managers (13-F Returns)
-
Recently Viewed Managers
- Portfolios (13-F Returns)
-
All Your Portfolios
-
Symmetric Portfolios
Scheduled reports
| Report | Frequency | Manager/Portfolio |
|---|
Downloading report
